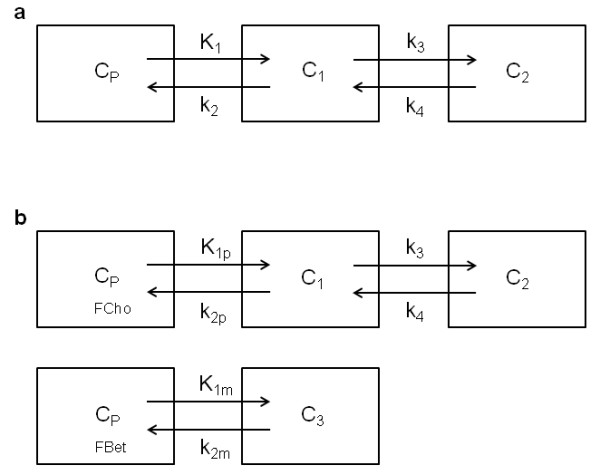
Figure 1.

Visual representation of the different kinetic models. (a) Schematic of a two-tissue-compartment model with one input function (2C1i). Transfer coefficients K1 and k2 describe the uptake and washout of the free tracer and its metabolite ([18F]FBet) across cell membranes. Rate constant k3 is regarded as the conversion of [18F]FCho into [18F]FPCho, which is assumed to be metabolically trapped in the cell. Micro-parameter k4 represents dephosphorylation and is expected to be very small. (b) Schematic of a three-tissue-compartment model with two input functions (3C2i). Rate constants K1p and K1m, or k2p and k2m represent respectively the uptake and washout of [18F]FCho and [18F]FBet.
