
Figure 2.
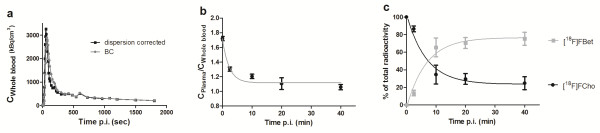
Determination of the arterial input function. (a) A time-activity curve determined by the blood counter (grey circles) and for the dispersion-corrected whole blood curve (black squares). (b) The single-phase exponential decay fitting of the ratio of the tracer plasma to blood concentration. Data points are expressed as mean ± S.D. (c) The single-phase exponential fitting of the percentages of [18F]FCho and [18F]FBet as a function of time after injection. Data points are expressed as mean ± S.D.