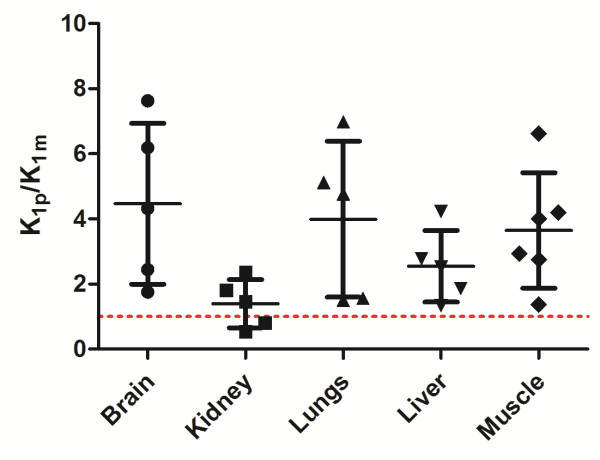
Figure 3.
Visual representation of the [18F]FCho-to-[18F]FBet uptake ratio in several tissues. The [18F]FCho-to-[18F]FBet uptake ratio represented by K1p/K1m was determined by the 3C2i model. The individual data points are shown, and the whiskers represent mean and S.D. The dotted line represents a ratio equal to 1.

