
Figure 7.
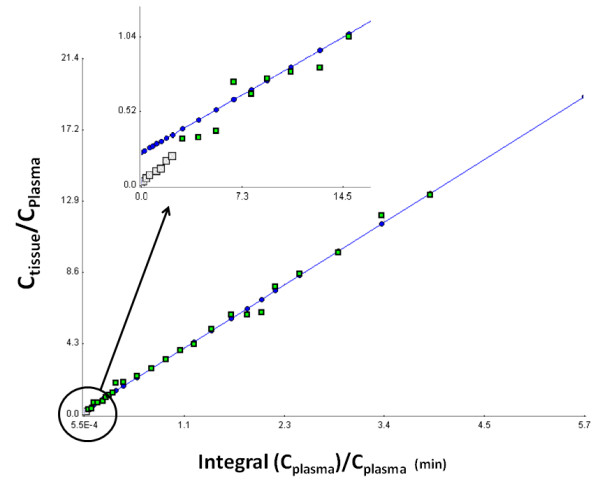
A visualization of the Patlak model under equilibrium conditions. The equilibrium conditions were obtained by selecting data points to obtain a linear regression. The grey and green squares represent the individual data points. The green squares are incorporated in the fitting under equilibrium conditions, whereas non-equilibrium fitting was performed on all the data points (i.e. grey and green data points). The fitting is represented by the blue line.