
Figure 2.
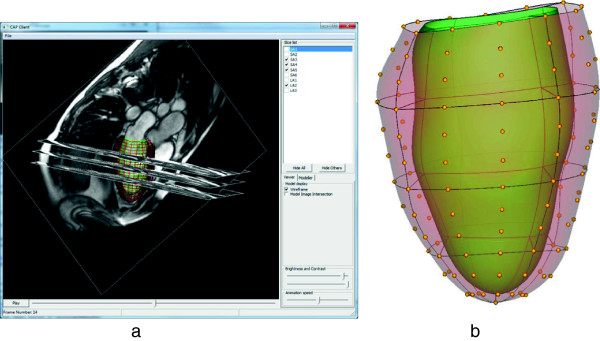
Mathematical shape model. a) 3D display of short and long axis images with the model embedded (CAP visualization tool available from http://www.cardiacatlas.org). LV shape model shown as wire-frame. b) Finite element description of left ventricular shape. Model parameters are shown as yellow points (endocardial parameters not shown). Element boundaries shown as lines; endocardial surface shaded green; epicardial surface shaded red and transparent.