
Figure 2.
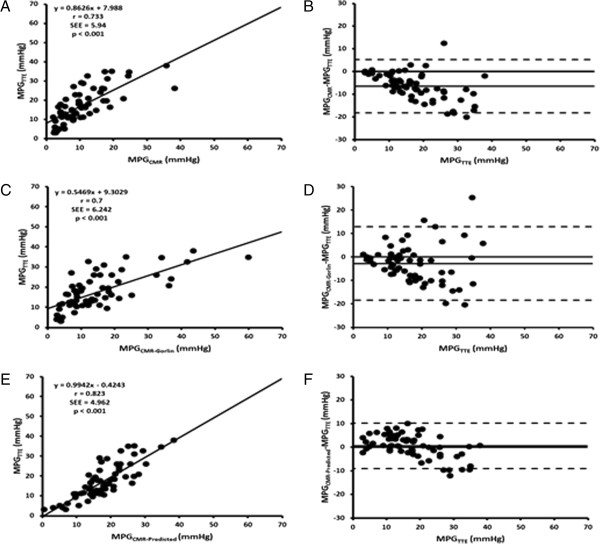
Comparison of mean transvalvular pressure gradients measured by TTE versus by CMR. Panel A shows the Pearson correlation plot for mean transvalvular pressure gradient measured by TTE (MPGTTE) and CMR (MPGCMR). Panel B shows the corresponding Bland-Altman plot. Panel C shows the Pearson correlation plot for mean transvalvular pressure gradient measured by TTE (MPGTTE) and predicted by Gorlin equation using CMR (MPGCMR-Gorlin). Panel D shows the corresponding Bland-Altman plot. Panel E shows the Pearson correlation plot for mean transvalvular pressure gradient measured by TTE (MPGTTE) and predicted model using vorticity and dimensionless stroke volume from CMR (MPGCMR-Predicted). Panel F shows the corresponding Bland-Altman plot.