
Figure 2.
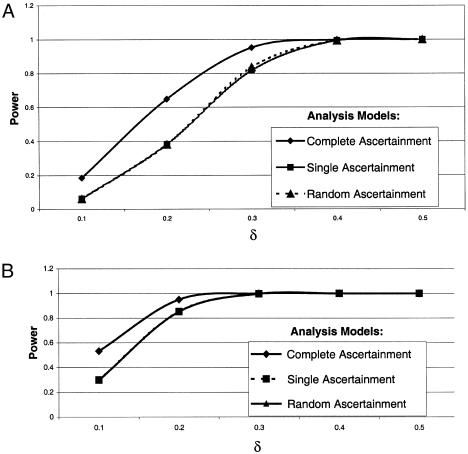
Observed power values from simulations of situation 2, for data sets generated under complete ascertainment (A) and data sets generated under single ascertainment (B). Mean f is 0.5. Note that the curves for single and random ascertainment are superimposed.