
Figure 3.
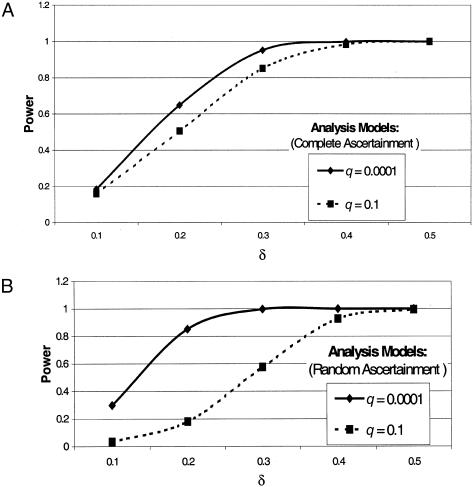
Observed power values from simulations of situation 3, for data sets generated under complete ascertainment and analyzed assuming complete ascertainment (A) and data sets generated under complete ascertainment and analyzed assuming random ascertainment (B). Mean f is 0.5.