
Figure 4.
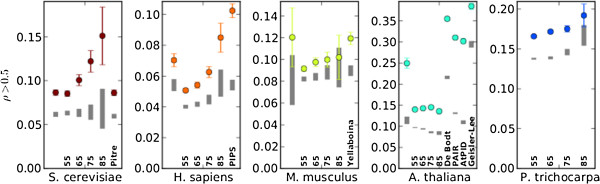
Significant co-expression. Dots show the observed frequency of interactors with ρ > 0.5. Error bars indicate 95% confidence intervals based on 250 bootstrapped replicates. Grey bars indicate 95% confidence intervals from 250 randomized networks. The leftmost lane for each organism with the exception of P. trichocarpa is the data for the experimentally-verified network.