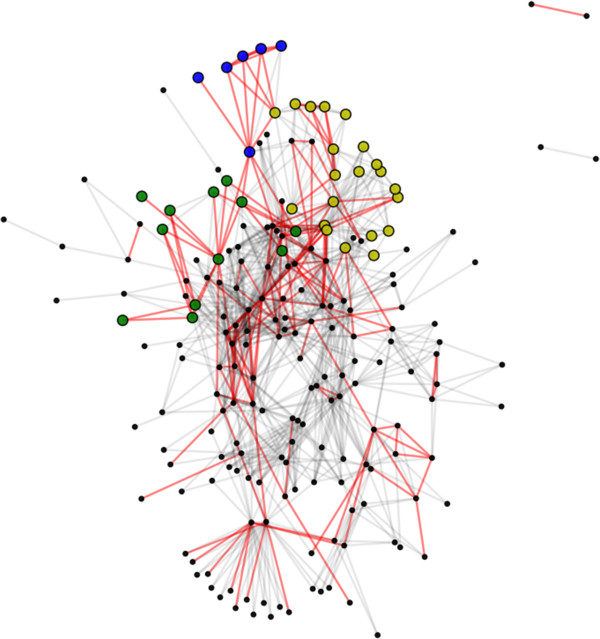
Figure 5.

P. trichocarpa metabolic linkage network. Each node represents a pathway in the PoplarCyc metabolic network, with lines connecting those with a significant number interpathway interactions based on ENTs predictions. Red lines indicate a shared compound between pathways. The yellow nodes belong to a cluster significantly enriched for fatty acid biosynthesis, while the green and blue nodes belong to pathways significantly enriched for nucleotide/nucleoside biosynthesis and degradation, respectively.
