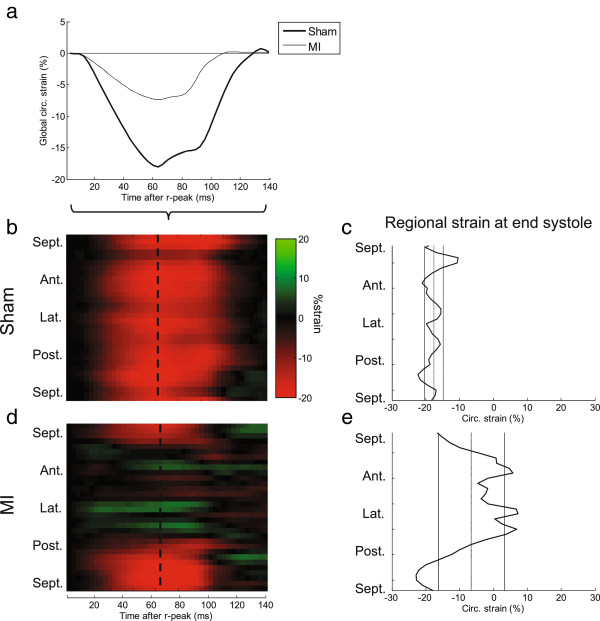
Figure 3.
Global and regional circumferential strain. For the same animals shown in Figure 2, the global circumferential strain (Sc) is shown here as a function of time (a). Furthermore, regional variation in temporally-resolved Sc is illustrated as color plots (b,d) where y-axis is circumferential position and x-axis is time after r-peak. Finally, the dispersion of Sc at end-systole (peak global Sc) is shown as a function of circumferential position (c,e). Mean and standard deviation of the global Sc at that time point is shown as vertical lines.

