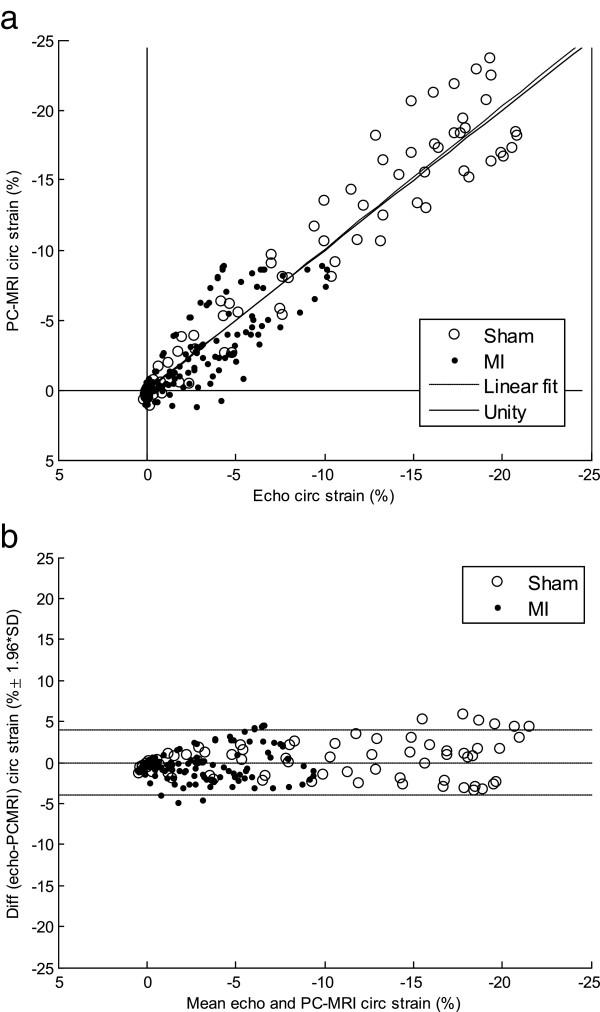
Figure 4.
Comparison of circumferential strain measurements from CMR and echocardiography. Scatterplot (a) and Bland-Altman plot (b) of the data from the validation of PC-CMR-derived global Sc against 2D speckle-tracking echocardiography. Each animal (N = 9) had 23 equally spaced time points covering the complete cardiac cycle, producing a total of N = 207 data points. The data demonstrate small limits-of-agreement with no significant bias.

