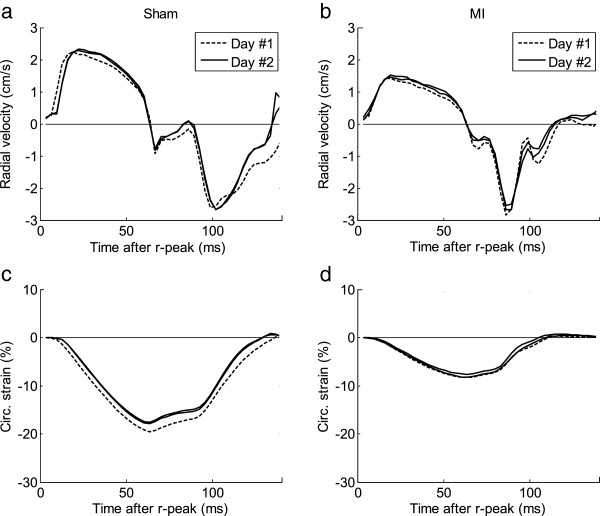
Figure 5.
Inter- and intrastudy variability. Inter- and intrastudy variability in two animals (one post-MI and one sham) are shown, illustrating the correspondence between velocity waveforms and magnitude (a,b), and Sc(c,d). All slices consisted of two rotations, and for intrastudy analysis the two individual acquisitions of the two slices were interleaved, attempting to reduce any physiological effects of different time spent under anesthesia.

