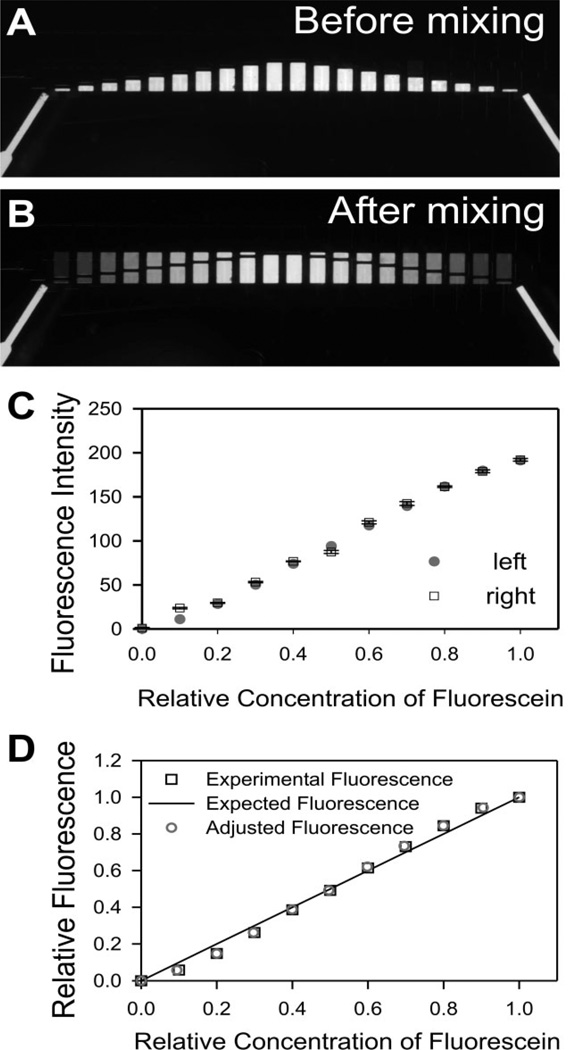
Figure 3.
Quantitative analysis of mixing precision with fluorescein. (A) Before mixing. Fluorescence image of isolated fluidic chambers, with array A containing deionized water and array B containing 1 mg/mL fluorescein. (B) After mixing. Fluorescence image showing results of 11 different dilutions. (C) Measured fluorescence intensities (after background correction) in the left (circles) and the right (squares) half of the device versus relative dye dilution. Error bars are SEM for three different regions from each chamber. (D) Comparison of the experimental results with predictions. Experimental fluorescence graph shows the relative intensity values (intensity from chambers of undiluted 1 mg/mL fluorescein solution is assigned the arbitrary value of 1) of the left half of the device as a function of the dilution factors (0, 1:10, 2:10, to 1:1); the expected fluorescence was calculated from the original design parameters; the adjusted fluorescence curve was obtained from the experimental fluorescence after factoring in the actual height and area of each microchamber (see text for details).

