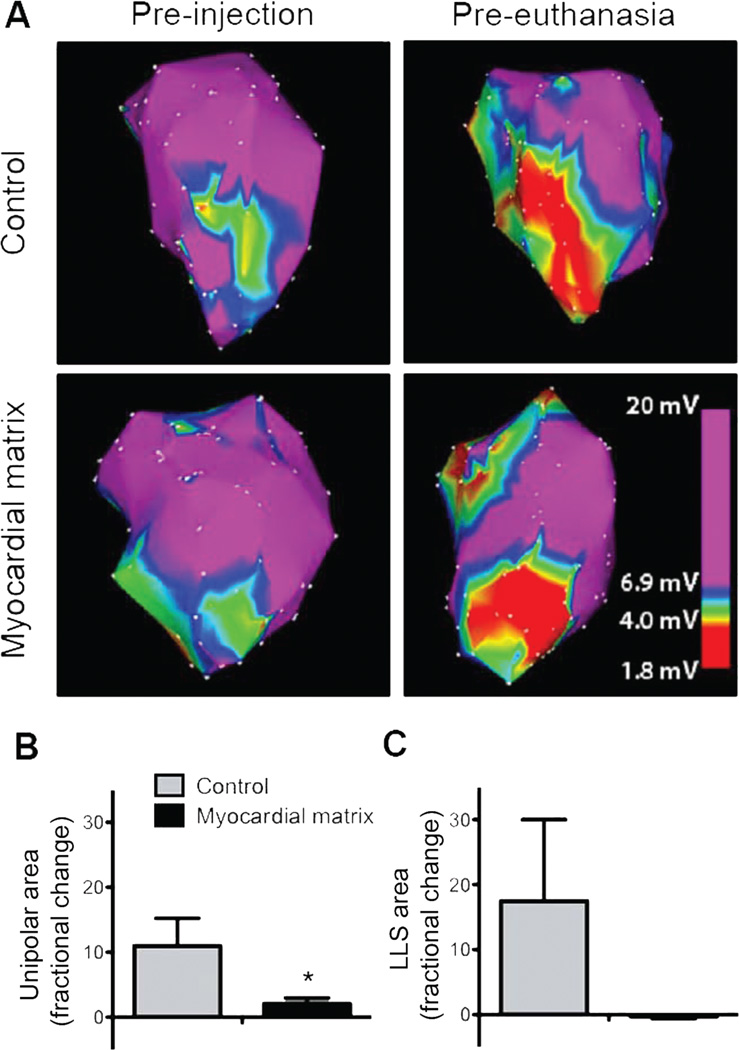
Fig. 2.
NOGA mapping and infarct expansion. (A) Representative unipolar area NOGA maps taken at time of injection and euthanasia. Images are thresholded to show the cutoff (6.9 mV) for the infarct area. (B) Infarct expansion calculated by unipolar area in myocardial matrix treated animals (n = 6) compared to the control group (n = 2). (C) Infarct expansion calculated via linear local shortening. Data are means +/− SEM. *p < 0.05 (Student’s t-test).

