
Figure 2.
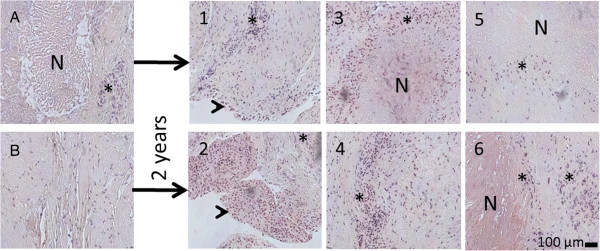
Histological images of removed tissues. Numbers correspond those shown in Figure 1. Interval between operations was 2 years, A and 1, B and 2 are samples from same anatomical site, respectively. Arrowheads indicate epithelial tissue, * indicates inflammatory cells, mostly macrophages, N indicates necrosis in the rheumatoid nodulus.