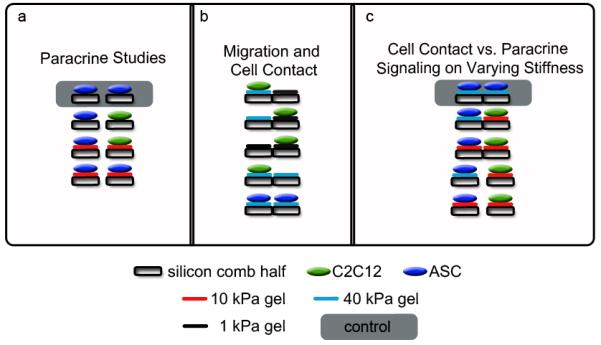
Figure 3. Experimental setup. Schematics explaining all cell culture setups to demonstrate utility of the technology.

The gray shaded cultures are those to which the qPCR results are normalized. (a) Gap studies comparing 10 kPa gels to bare silicon on the combs with ASC’s (blue) and myoblasts (green). The results are shown in Figure 4. (b) Migration studies with myoblasts were used in the permutations described with various gel types in contact. ASC’s on 40 kPa were also stained to show contact on the same plane on different comb halves. Results are shown in Figure 5. (c) ASC differentiation on various gel stiffness in either contact or gap mode. Gene expression studies using a combination of 10 and 40 kPa gels in gap or contact were analyzed to show changes in myogenic gene expression. IF and qPCR results are shown in Figure 6.
