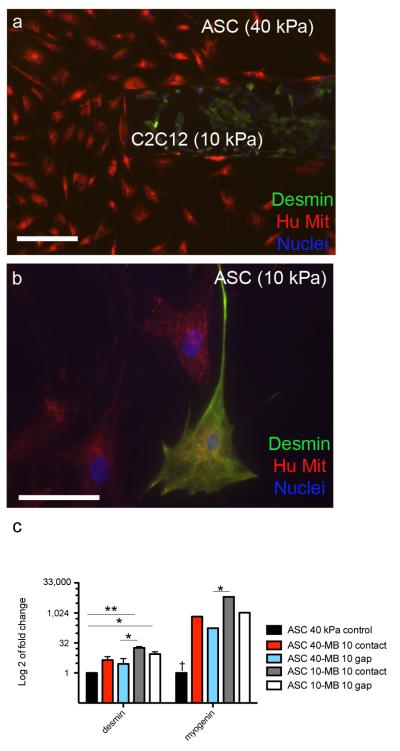
Figure 6. Differentiation of ASCs in co-cultures on 40 or 10 kPa gels in contact or gap.
Co-cultures were setup with the following groups: ASC (40 kPa)-ASC (40kPa) contact, ASC (40 kPa)-myoblast (10 kPa) contact and gap, and ASC (10 kPa) – myoblasts (10kPa) contact and gap (5 groups, n=3/group). (a) Myoblasts stained positive for Desmin (green) on a 10 kPa gel and ASC’s stained for human mitochondrial DNA (red) on a 40 kPa gel are placed in contact, scale bar = 200 μm. (b) A representative image of a positively stained Desmin cell on an ASC half of a comb on 10 kPa gel, scale bar = 25 μm. (c) qPCR results showing all groups normalized to ASC’s on 40 kPa gels. Fold change on a log 2 scale is used to clearly represent the data in graphical form (*p<0.05, **p<0.01). Myogenin in the ASC 40 kPa control is significantly downregulated compared to all other groups († p<0.01). Error bars have been included in all data contained in the graphs.

