
Fig. 3.
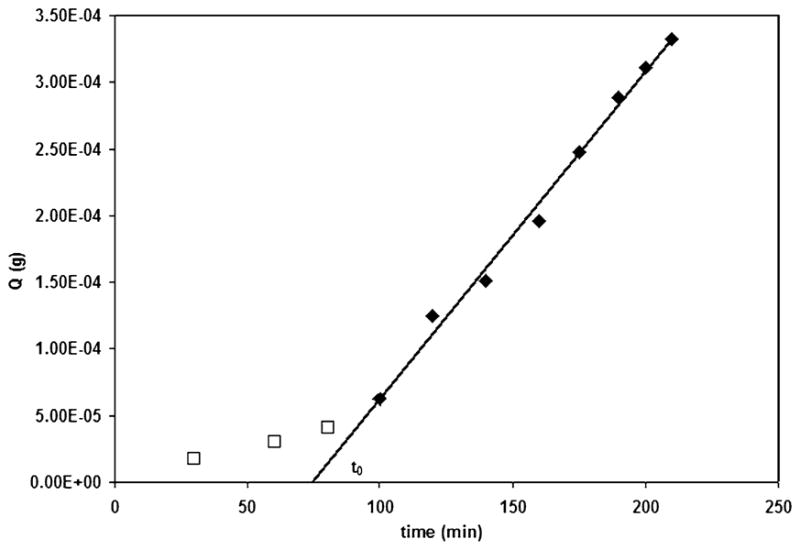
A representative plot of glucose flux through a sIPN membrane. The lag time t0, was used to determine the diffusion coefficient D, of glucose
Official websites use .gov
A
.gov website belongs to an official
government organization in the United States.
Secure .gov websites use HTTPS
A lock (
) or https:// means you've safely
connected to the .gov website. Share sensitive
information only on official, secure websites.
A representative plot of glucose flux through a sIPN membrane. The lag time t0, was used to determine the diffusion coefficient D, of glucose