
Figure 3.
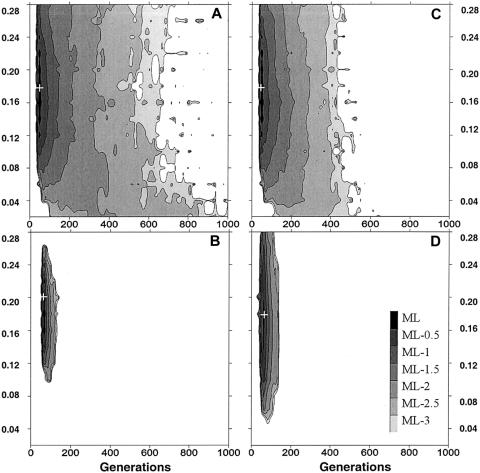
Likelihood surface of the age of the βS mutation, obtained by Monte Carlo simulation of the spread of a new mutation. The neutral linked marker corresponds to the 5′ RFLP cluster data in which no diversity is found in 45 βS chromosomes. When the estimation given by Harding et al. (1997) is used, the estimated mutation rate is 1 × 10⁻⁶ per generation taken as average for 30 bp. The estimated recombination rate between the βS mutation and the 5′ RFLP cluster is 1.6 × 10⁻³ per generation (Chakravarti et al. 1984). A, Stationary population N = 1,000. B, Stationary population N = 10,000. C, Logistic growth, N0 = 1,000, K = 10,000, r = .001. D, Logistic growth, N0 = 1,000, K = 10,000, r = 0.02. Plus sign (+) indicates the ML estimator.