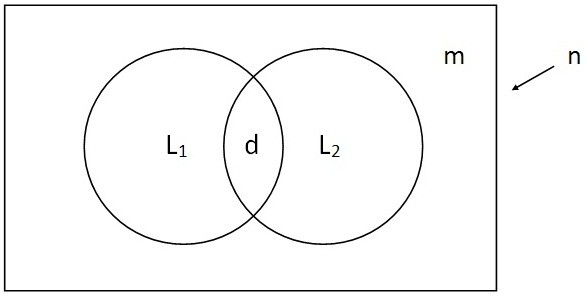
Figure 1.

Schematic description of the distribution of the total number of cases in a two-source capture-recapture model (Venn diagram). n is the total number of cases in the population, L1 and L2 the number of cases captured by each one of the two systems, m the number of missing cases from both systems and d the duplicates.
