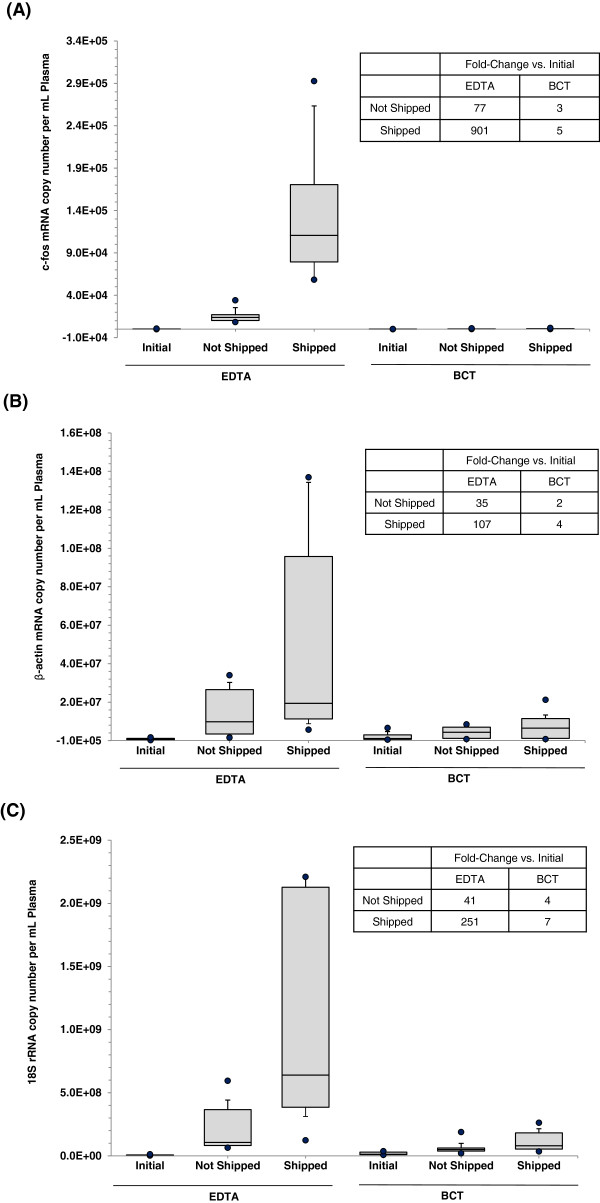
Figure 2.
Effect of shipping on cfRNA concentration in blood samples. Blood was drawn into K3EDTA tubes and BCTs and either shipped round trip to a lab in Springfield MA or not shipped (n = 10). On day 3, plasma from shipped and non-shipped samples was isolated and cfRNA concentrations were determined by measuring c-fos mRNA (A), β-actin mRNA (B) and 18S rRNA (C) using RT-qPCR. Overall, the BCTs prevent cfRNA concentrations from significant increases as compared to the K3EDTA tubes during transportation and room temperature storage. Box plots show the median (line inside the box) and 75th and 25th percentiles (limits of the box). The upper and lower error bars indicate the 90th and 10th percentiles, respectively. The upper most and lower most dots indicate the maximum and minimum values.

