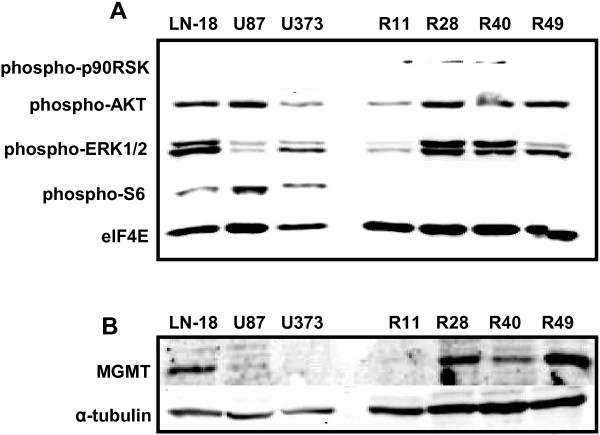
Figure 1.
Brain CSC lines (R11, R28, R40, R49) display activated AKT/MAPK pathway and differential MGMT expression. (A) Immunoblot of GBM cell lines (LN-18, U87-MG, U373-MG) and brain CSC lines (R11, R28, R40, R49) using the Multiplex PathScan antibody cocktail. ElF4E served as loading control. (B) Immunoblot showing MGMT expression. Tubulin served as a loading control. Brain CSC lines showed differential expression of MGMT. Of the established GBM cell lines, only LN-18 showed MGMT expression. R28 cells showed high MGMT expression and were used for the orthotopic mouse GBM model.

