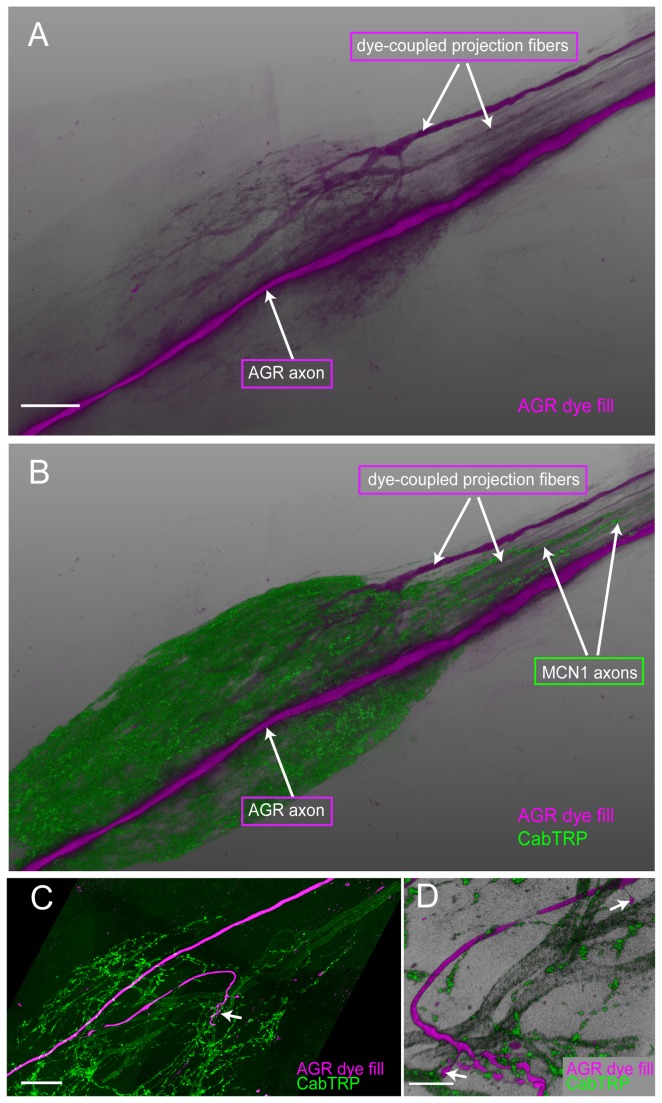
Figure 5. Dye coupling reveals putative electrically coupled neurons.
A. Long-term (2 hours) LY dye-fill of the AGR neuron (magenta) revealed dye-coupled descending STN fibers. B. Double labeling for CabTRP in the same preparation shows that the dye-coupled STN fibers were not MCN1 projections. A and B are blend mode projections of 12 merged confocal image stacks, each consisting of 200 optical slices (acquired at resolution of 0.187µm x 0.187µm x 0.504µm). Scale bar is 50µm. C. AGR processes (LY dye-filled, magenta) are in close apposition to projections from the MCN1 neurons that were labeled with an anti-substance P antibody (green). Blend mode projection of 12 merged confocal image stacks, showing a 47µm thick mid-section of the ganglion (127 of 210 optical slices, acquired at resolution of 0.187µm x 0.187µm x 0.713µm). Scale bar is 50µm. D. A close-up of the neuropil shows a claw-like ending of the LY dye-filled AGR projection (magenta) in close contact with fine MCN1 processes (green), and two distinct AGR terminals in apparent contact with larger-diameter MCN1 processes (arrows). Blend mode projection of 24µm thick mid-section in the same preparation as 4B, rotated 180° around the dorso-ventral axis (66 of 210 optical slices, acquired at resolution of 0.187µm x 0.187µm x 0.713µm). Scale bar is 15µm.

