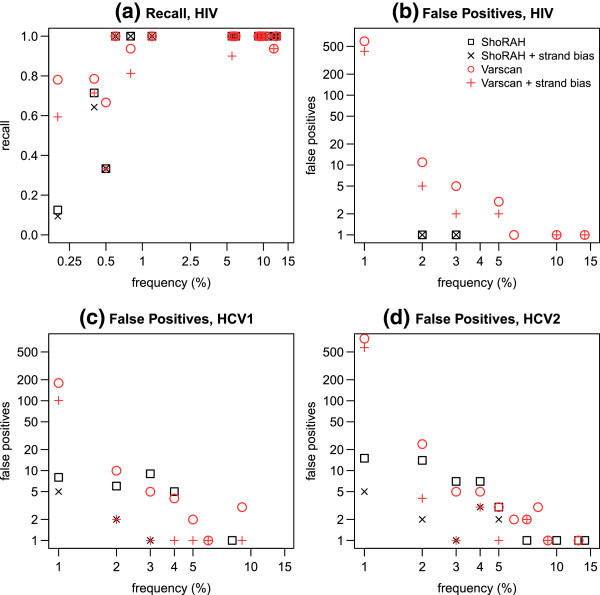
Figure 2.
SNV recall and false positives by frequency. Detailed analysis of SNV calling for variants with population frequency less than 15%. Both raw results, and results subjected to a strand bias test with σ=0.0111, are given. In cases where cross hairs fill a symbol of the same colour, the strand bias test had no effect on results. (a) Recall of true SNVs for HIV data, by frequency (calculated using known haplotype frequencies (see Table 2)). Note: for SNVs with population frequency greater than 15%, recall was perfect for all methods. For this reason, recall plots for HCV1 and HCV2 are also omitted, as they are straight lines with perfect recall = 1. (b) HIV, (c) HCV run 1, and (d) HCV run 2, absolute false positive SNV counts by predicted frequency for each method, binned in intervals of 1%. A double logarithmic scale is used for plots (b), (c), and (d); thus data points where no false positives are recorded are omitted. For all ShoRAH runs, no false positives were observed with population frequency greater than 15%. Some false positives with population frequency greater than 15% occurred for the VarScan runs, however close inspection revealed the majority of these to be the result of a VarScan bug when calling SNVs for genomic positions with two or more variants.

