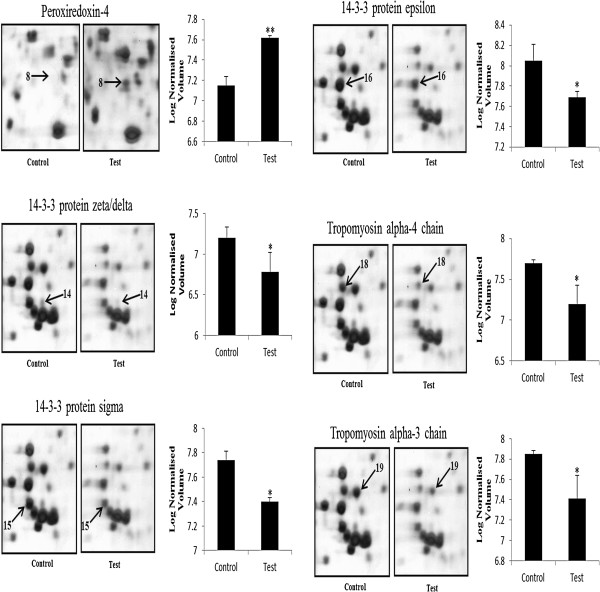
Figure 3.
Enlargements of the 2-DE map of proteins from AGS gastric cancer cells treated with vitamin C, which displays corresponding sections of gels with protein spots derived from control and vitamin C treated cells. Three independent experiments were performed and the mean ± SD was plotted (*P < 0.05, **P < 0.01 compared with control).

