Figure 2.

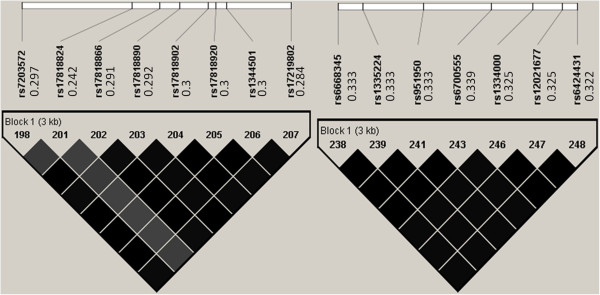
Pair-wise r2 among the selected FTO region and NEGR1region. The values to the right of the dbSNP IDs (rs# IDs) are the corresponding minor allele frequencies.

Pair-wise r2 among the selected FTO region and NEGR1region. The values to the right of the dbSNP IDs (rs# IDs) are the corresponding minor allele frequencies.