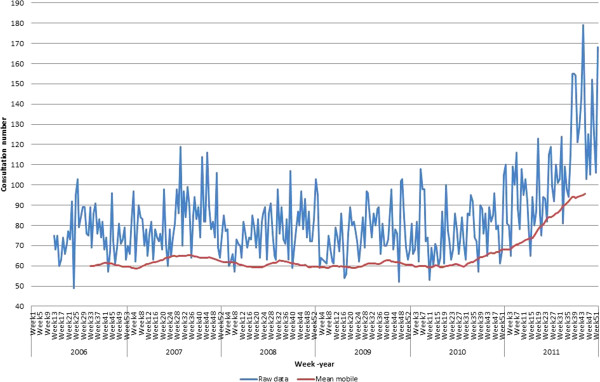
Figure 3.

Pattern of consultations at antirabies medical centre (ARMC) – Institut Pasteur de Madagascar (IPM), Antananarivo, 2006–2011. Mean of weekly visit counts at ARMC (IPM) for 5 years. Weekly visit time series plots (number) (blue-curve) and the moving average (red-curve) for weekly visit counts.
