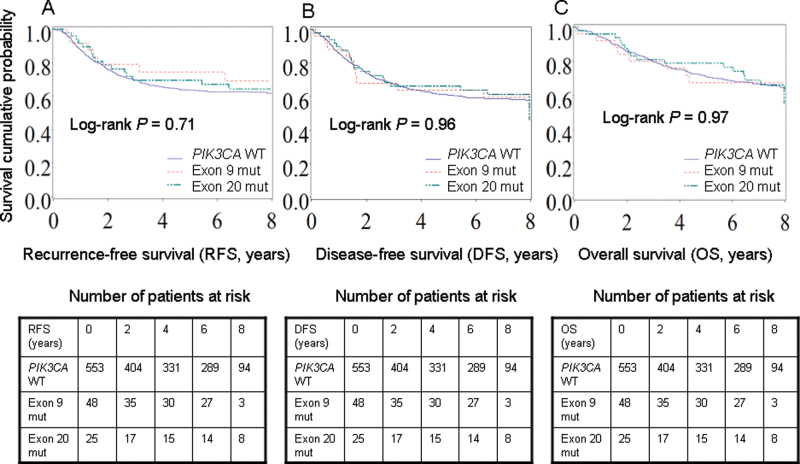
Figure 1.
Kaplan–Meier curves according to PIK3CA mutation in stage III colon cancers for recurrence-free survival (RFS) (A), disease-free survival (DFS) (B), and overall survival (OS) (C). Tables of the numbers of patients at risk are below the graphs.
Exon 9 mut = mutation in only exon 9; Exon 20 mut = mutation in only exon 20; WT = wild-type.

