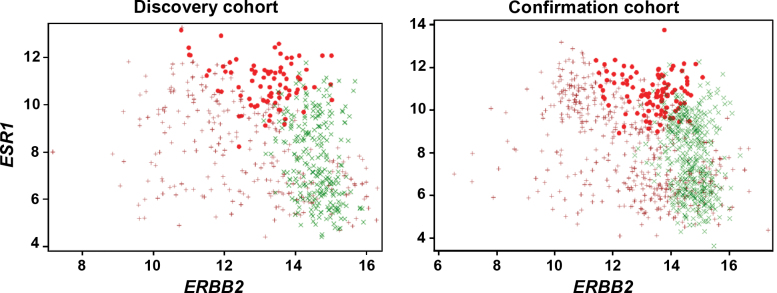
Figure 4.
Nonlinear interaction between expression levels of ESR1 and ERBB2 and trastuzumab benefit. Tumors from patients with no benefit expressed moderate levels of ERBB2 mRNA and high levels of ESR1 mRNA. Red circles indicate Group 1, no benefit; brown crosses indicate Group 2, moderate benefit; Green Xs indicate Group 3, large benefit.

