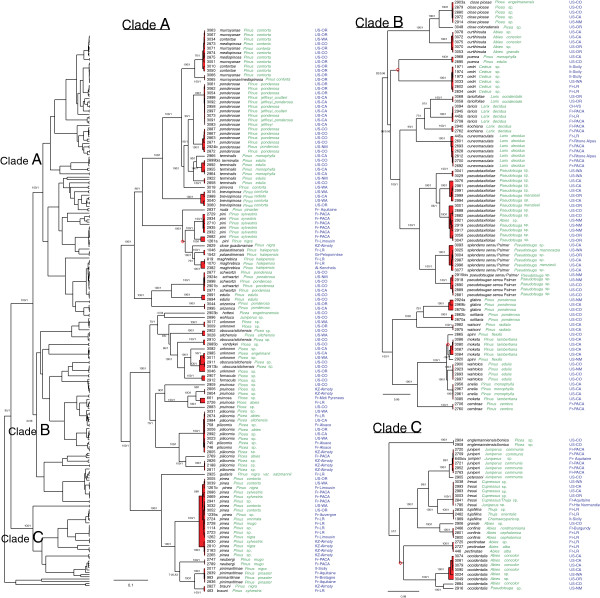
Figure 1.
Molecular phylogenetic hypothesis for Cinara species resulting from BEAST analysis using a Yule tree prior. The topology on the left corresponds to the topology obtained with all specimens, it is divided into 3 sub-trees A, B and C, corresponding to the clades indicated in the global tree. Numbers at nodes correspond to ML bootstrap values > 50 and to BEAST posterior probability values > 0.80. ♦ Red rhombuses correspond to nodes that were not present in the ML tree. For each specimen, voucher number, species morphological identification, host species, sampling locality are indicated from left to right. The red coloration delimits clusters of specimens recognized as species by the GMYC method.

