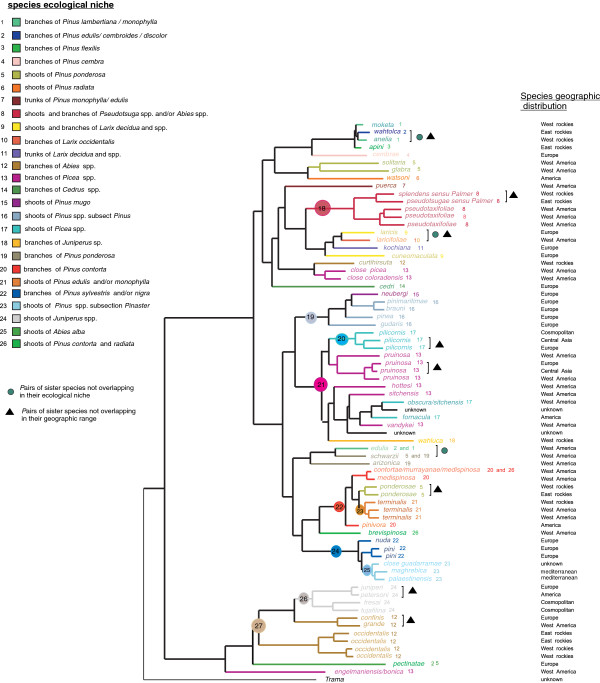
Figure 4.
Evolution of niche differentiation among species as inferred by MP using Phylotype: branch colors and numbers correspond to a niche (an ecological niche being defined by the combination of host-plant species range and feeding sites). Species names are followed by a number referring to their ecological niche. The root node identifiers of phylotypes are provided and refer to numbers in Table 1. Fine scale (regional) geographic distribution of each species is indicated at the right end of the figure. ● Green dots indicate species pairs that do not overlap in their ecological niche. ∆ Black triangles indicate species pairs that do not overlap in their geographic distribution.

