
Figure 2.
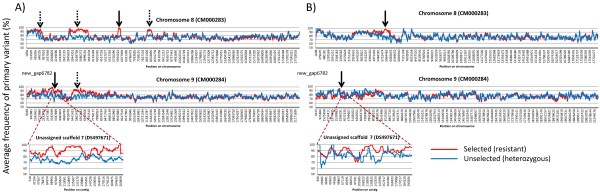
Average SNP frequency across Chr8 Chr9 and Uns-7, from A) F4 and B) F19 datasets (Selected vs Unselected). The window size used was an average of 300 cells (or 50 cells for Uns-7) in the spreadsheet analysis. The x-axis is a non-linear scale determined by the number of SNPs in the dataset. The regions showing linkage to resistance are highlighted by a dashed arrow; solid arrow indicates regions where the resistance loci were confirmed by fine-scale linkage mapping.