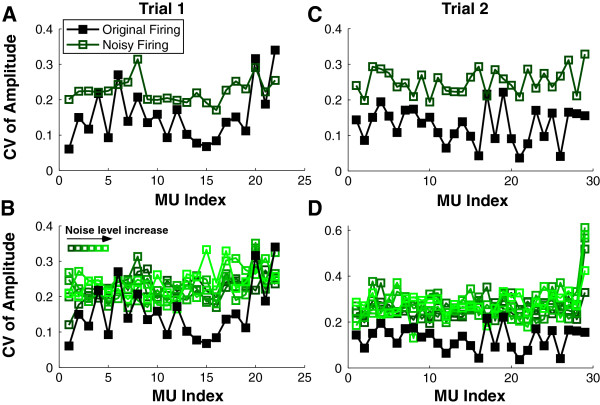
Figure 4.
CV of P-P Amplitude of the STA estimates. A: The CVs of amplitude using the original firings are shown in filled squares. The CVs calculated based on noisy firings (SD of noise = 0.1 * SD of ISIs) are shown in open squares. B: The CVs calculated based on noisy firings (SD of noise = n * SD of ISIs) are shown in open squares. The noise level increment (n increased from 0.1 to 0.6) was color coded. The CV results of a second trial are shown in C and D using the same symbol notation as in trial 1.

