
Figure 3.
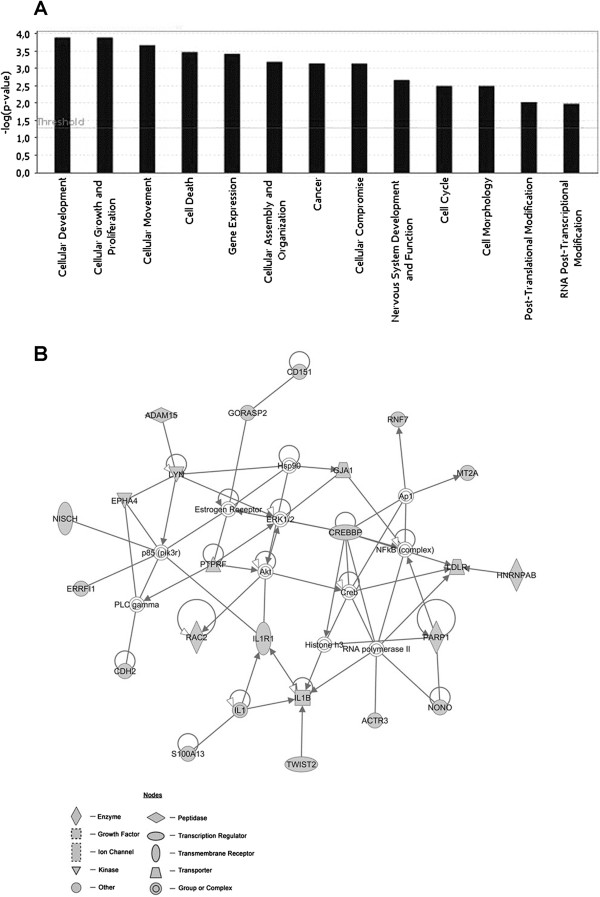
IPA functional analysis and first top network associated with the Cluster 1. (A) Bar chart shows key function associated with genes found to be up-regulated (cluster 1) in WJ-MSCs after 12 passages of their in vitro expansion, as compared to WJ-MSCs at the 4th passage. (B) Network cluster 1: in grey are represented the genes up-regulated in WJ-MSCs after 12 passages of their in vitro expansion, as compared to WJ-MSCs at the 4th passage. Transcripts not modulated along with the different passages are represented in white. Arrows indicate that a molecule acts on another molecule, while lines indicate a bind between two molecules.