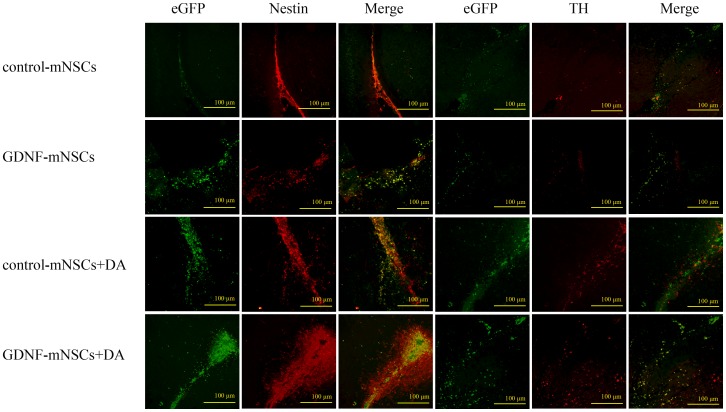
Figure 6. Survival and differentiation of transplanted cells in the striatum.
Representative photomicrograph illustrating that many transplanted cells survived in the striatum. There were more eGFP+ (green), nestin+ (red), nestin+/eGFP+(merged yellow), TH+ (red), and TH+/eGFP+ cells (merged yellow) in the GDNF-mNSCs+DA group than in the other groups. Scale bar = 100 µm. Green: FITC, Red: TRITC.

