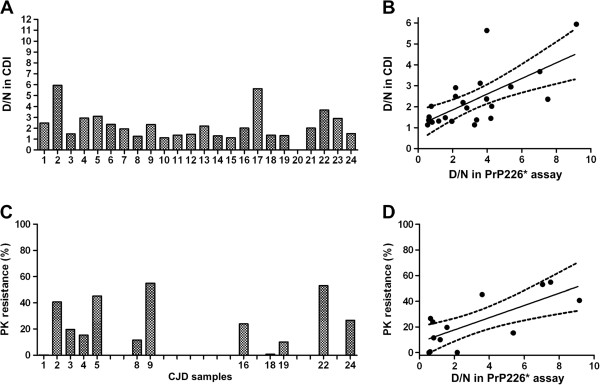
Figure 5.

CDI and PK resistance of PrPSc in CJD samples and the correlation with the PrP226*assay. (A) 23 out of 24 CJD/GSS brain homogenates were analyzed with FH11/3F4-b DELFIA and D/N ratios were calculated. (B) Correlation diagram between D/N ratio in PrP226* assay and D/N ratio in CDI. (C) 12 out of 24 CJD/GSS brain homogenates were digested with 50 μg/ml PK. Western blots were developed with 3F4, density of bands was evaluated and expressed as a percentage of the resistant PrP compared to the non-digested PrP. (D) Correlation diagram between D/N ratio in PrP226* assay and PK resistance.
