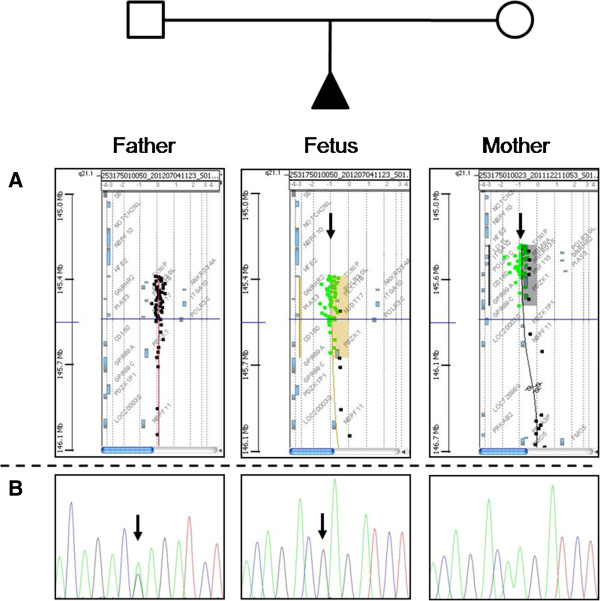
Figure 2.

Molecular characterization of the pedigree. Panel A: aCGH profile of the nuclear family indicating normal genomic content in the mother at 1q21.1 region, while in the fetus and father the typical deletion is present (black arrows). Panel B: sequencing of RBM8A at rs139428292 showing the minor A allele at the heterozygous state in the mother and at the homo(hemi)zygous state in the fetus (black arrows), while the father is homozygous for the major G allele.
