
Figure 3.
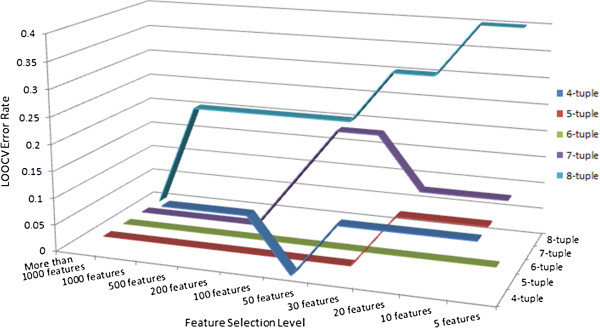
The LOOCV error rates on real genome data. This figure shows the LOOCV error rates of different feature lengths and at different feature selection levels on the tree genome data. Each line stands for the LOOCV error rates of one feature length.