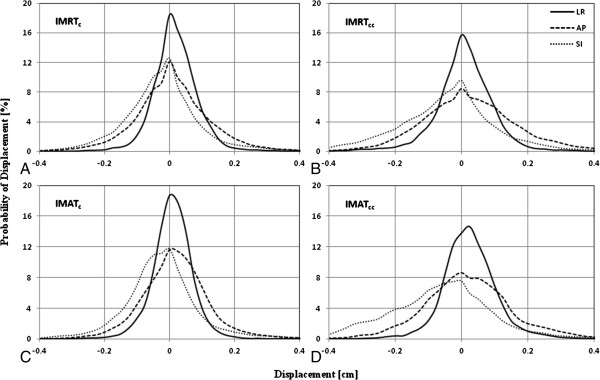
Figure 2.

Histogram analysis showing the probability of displacement of beacon centroid as a function of motion amplitude. Displacement is measured along the lateral (LR), longitudinal (SI), and frontal (AP) directions for IMRTc (A), IMRTcc (B), IMATc (C), and IMATcc (D).
