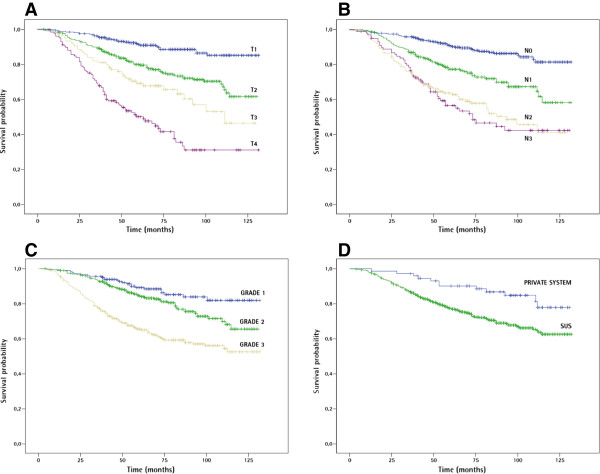
Figure 1.
Kaplan-Meier curves of factors associated with breast cancer survival. A, breast cancer-specific survival in relation to tumor size (p < 0.001). B, survival in relation to lymph node status (p < 0.001). C, survival in relation to histologic grade (p < 0.001). D, survival in relation to health care system (p = 0.006).

