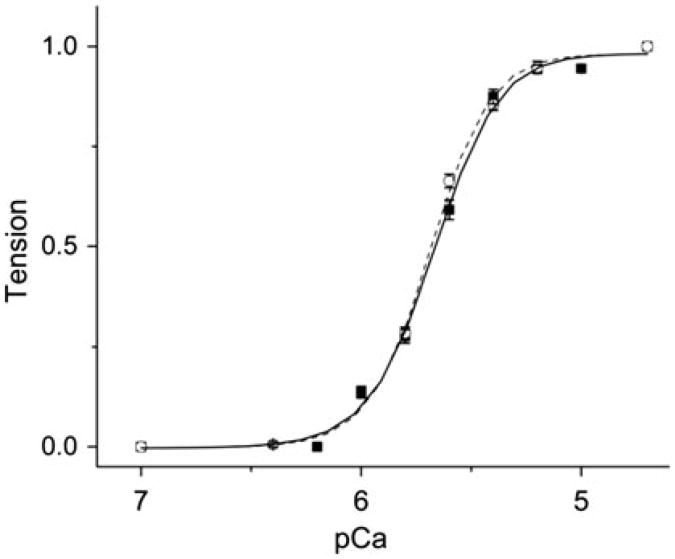
Fig. 1.
pCa-tension plot of the native cardiac muscle fibers and fibers reconstituted with BVC actin + Tm + Tn. (circle) Native fibers. (square) Fibers in which thin-filament was removed and reconstituted with bovine cardiac actin, Tm, and Tn. The symbols represent the data points and the curves represent best fit values to the Hill equation. (This figure is re-plotted from Bai et al. 2013)

