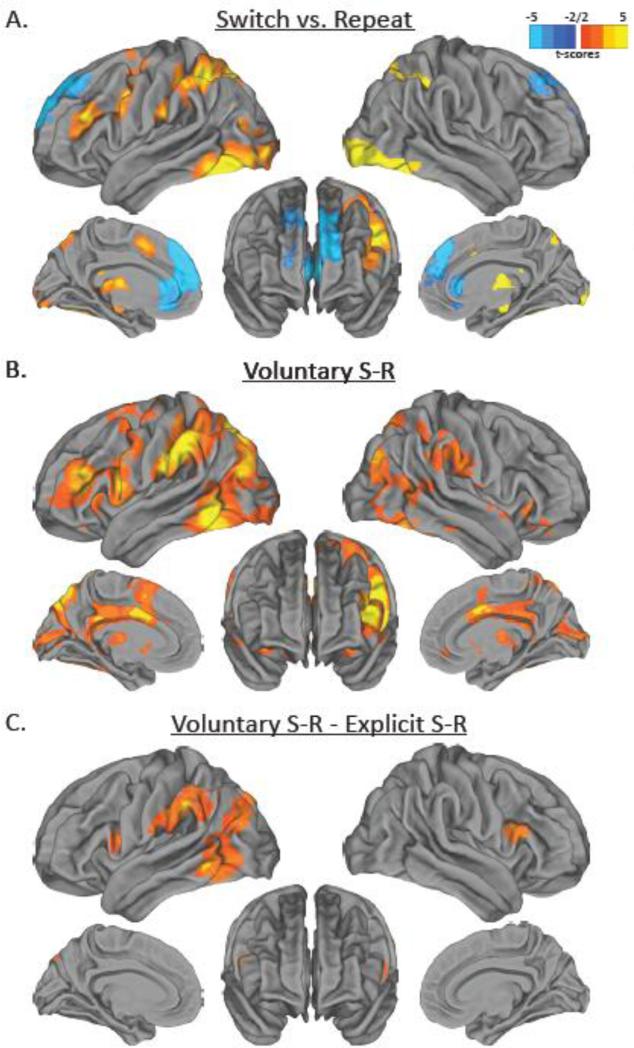
Figure 3.
Results from comparison of task switch and task repeat trials. (a) Activations in hot colors represent regions that were significantly more active for task switch trials compared to task repeat trials. Activations in cold colors represent regions that were significantly more active for task repeat trials compared to task switch trials. (b) Activations in hot colors represent regions that were significantly more active for voluntary task switch trials compared to voluntary task repeat trials. (c) Activations in hot colors represent regions that were significantly more active for voluntary task switch minus task repeat trials compared to explicit task switch minus task repeat trials.

