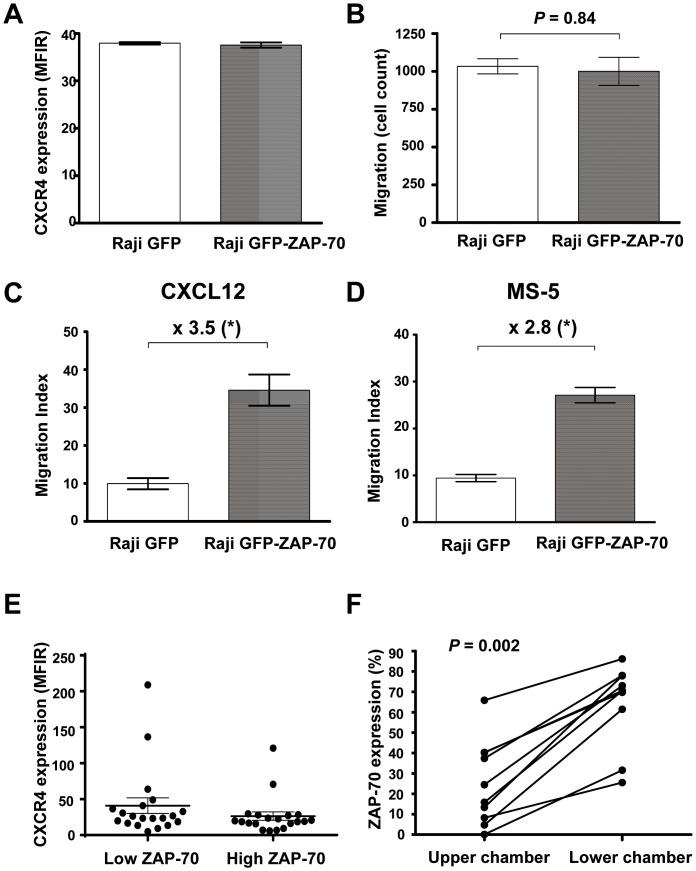
Figure 3. ZAP-70-positive cells have increased migrative capacity toward CXCL12 and the BMSC cell line MS-5.
(A) Mean fluorescence intensity ratio (MFIR) of CXCR4 surface staining in Raji GFP and Raji GFP-ZAP-70. (B) Raji transfectants were subjected to migration assay for 4 hours at 37°C in 5% CO2 with medium containing CXCL12 (100 ng/mL) in the upper and lower chamber. Migrated cells were counted with a Navios cytometer under a defined flow rate for 5 minutes. (C).Raji transfectants were subjected to migration assay toward CXCL12 (100 ng/mL) or the stromal cell line MS-5 (D) for 4 hours at 37°C in 5% CO2 and cells in the lower chamber were counted with a Navios cytometer under a defined flow rate for 5 minutes. *P<.05 (Mann-Whitney test). Results are shown as the mean ± SEM of at least 4 independent experiments. (E) MFIR of CXCR4 surface staining in 20 patients with low ZAP-70 expression and 20 patients with high ZAP-70 expression. Results in the graph show mean ± SEM. (F) Peripheral blood mononuclear cells from 10 patients with CLL were subjected to migration assays toward CXCL12 (100 ng/mL) for 6 hours at 37°C in 5% CO2. The percentage of CD19+/CD5+/CD3- CLL cells expressing ZAP-70 was determined in the cellular fraction remaining in the upper chamber and in the cellular fraction of transmigrated cells for each patient by flow cytometry. Wilcoxon test was used, and P<.05 was considered significant.

