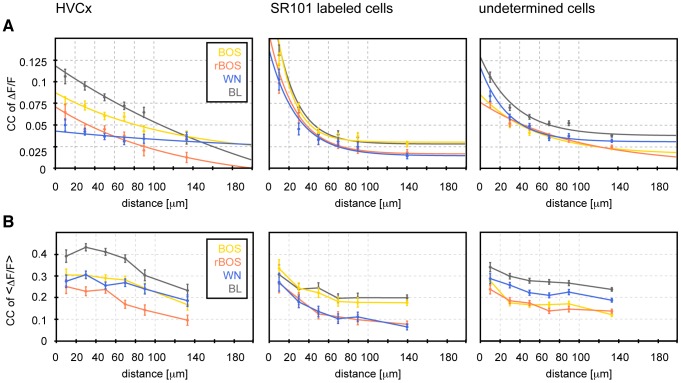
Figure 7. Spatial decay of signal synchrony and response correlation.
A The average pairwise synchrony (CCs, on the time scale of 0.1 s) in different cell types decreases as a function of the distance between ROI centers. In HVCX neurons the synchrony is strongest during baseline (black) and weaker during BOS (yellow) and even weaker during WN (blue) and rBOS (red). In astroglia the spatial decay of synchrony during baseline and during auditory stimulation are roughly identical. Exponential fits (smooth curves) to non-binned data reveal a large space constant for HVCX neurons (e.g. λ = 263 µm during baseline) and a much smaller space constant for astroglia (e.g. λ = 22 µm during baseline). Distances were sampled in 20 µm bins (dashed vertical lines coincide with bin boundaries). The last bin contains all data points with pairwise distances >100 µm. Error bars are standard errors of the mean (SEM). B On a larger 2 s time scale, ΔF/F signals averaged over stimulus periods (3 s windows for baseline - BL) are more strongly correlated but decay more flatly, suggesting slow spreading of calcium signals. In particular, on this timescale, the spatial correlation profile in astroglia resembles that of HVCX neurons on the faster time scale in A, with BOS eliciting higher correlations than other stimuli.

