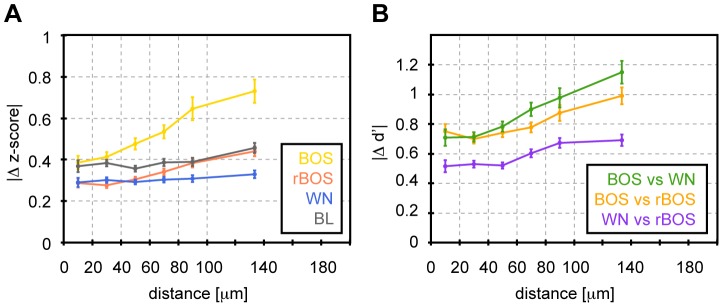
Figure 8. Spatial clustering of auditory responsiveness and selectivity in HVCX neurons.

A Z-scores for BOS are more similar in nearby cells than in more distant cells. Plotted are absolute Z-score differences as a function of distance between HVCX neurons (ROI centers). Error bars depict the standard error of the mean (SEM). B A similar behavior is seen for d′ values that for BOS are more similar in nearby cells than in more distant cells. Distance binning as in Figure 7.
