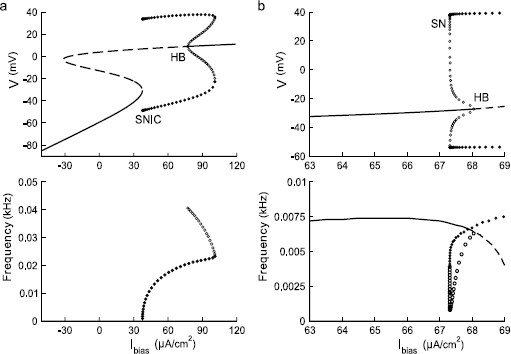
Fig. 1.
Bifurcation diagrams and the corresponding f– relationship near a Type I (a) and a Type II (b) transition in the Morris–Lecar (ML) model. is the control parameter. Stable and unstable equilibria are marked with solid and dashed lines, respectively. Stable and unstable periodic solutions are marked with filled and open circles, respectively. The intrinsic frequency of a steady state is determined by the imaginary part of the eigenvalues of the Jacobian matrix for the corresponding system linearized about the steady state. These diagrams were obtained using the XPPAUT package by Ermentrout [35]

