
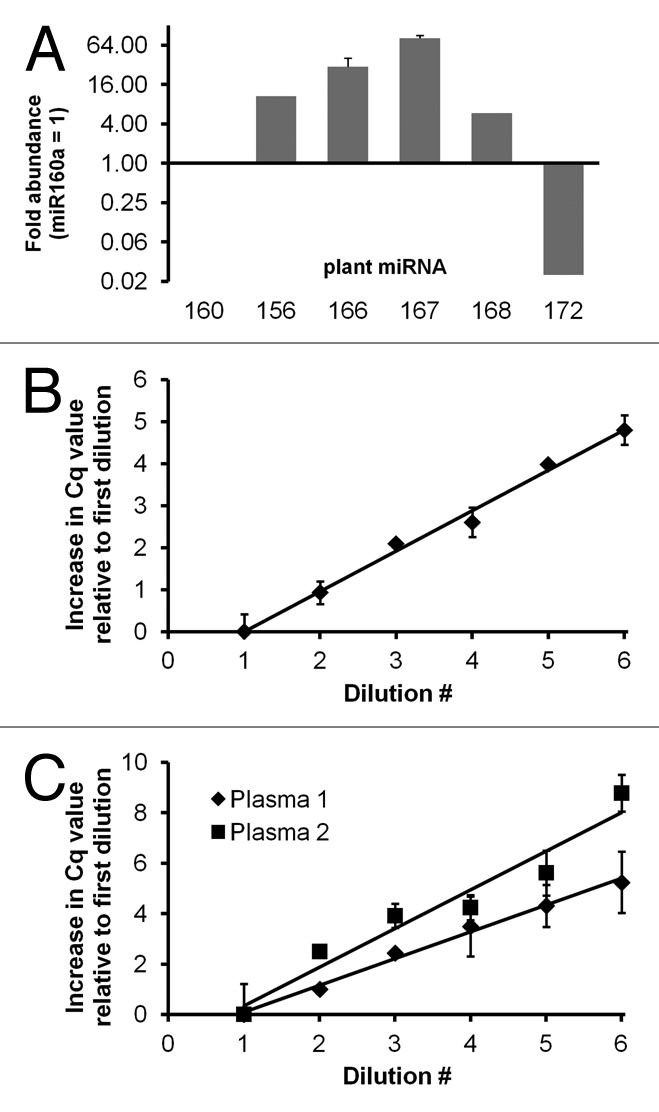
Figure 1. miRNA abundance and amplification efficiency in a plant-based dietary substance and in mammalian plasma. (A) Relative abundance of several highly conserved plant miRNAs in a soy- and fruit substance. RNA was purified from 100 µl “Silk” using the mirVana total RNA isolation protocol (Ambion/Life Technologies). Hydrolysis probe-based RT-qPCR measurements were made from up to three independent RNA isolations. Fold abundance was calculated relative to miR160. Similar results were obtained at different input RNA dilutions (not shown). Error bars represent standard deviation. (B and C) RT-qPCR assay linearity and amplification efficiency was assessed (shown here: miR160) using 2-fold serial dilutions of cDNA prepared with mature miRNA-specific stem-loop primers and plant RNA from the dietary substance (B) or RNA from pre- or post-prandial plasma samples (C). For plant RNA, (B) starting dilution (#1) corresponded to cDNA from approximately 6.3 nanoliters of the original substance. Final dilution (#6) was from about 200 picoliters original volume. Amplification occurred in all wells, and amplification efficiency was approximately 100%. Error bars are standard deviation of triplicate measurements (less than half a cycle for all dilutions). For plasma, dilutions corresponded to material from 2 µl plasma (#1) down to 60 nl plasma (#6). Standard deviation corresponded to half a cycle or greater for 8 of 12 samples, and several wells within technical replicate groups did not amplify. Amplification efficiencies were 94% (plasma 1) and 65% (plasma 2).