
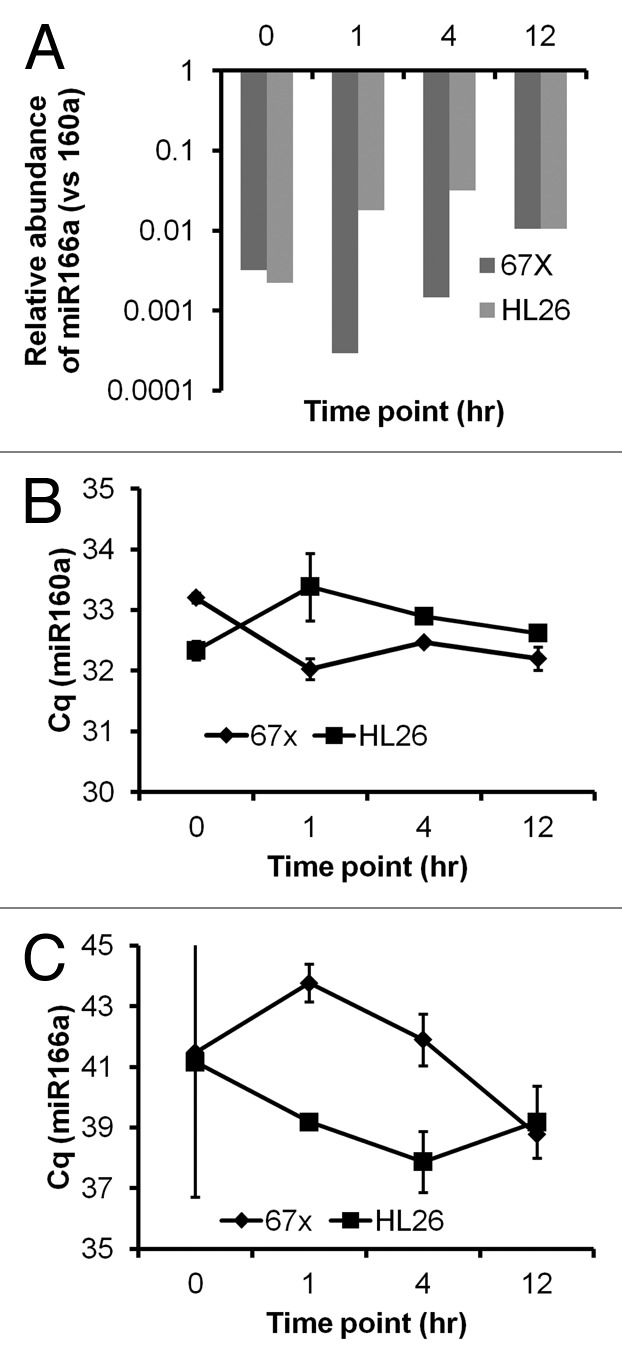
Figure 2. Plant miRNAs in circulation before and following intake of a miRNA-rich food source. (A) Apparent abundance in plasma of miR166 relative to miR160, as assessed by RT-qPCR with RNA samples purified by mirVana technique, did not match relative abundance in the food source at any time point pre- or post-prandial (compare with Fig. 1A) in either of two macaque subjects designated “67X” and “HL26.” (B and C) Plasma miR160 and miR166 Cq values and standard deviations by time point and subject (67X and HL26). Missing standard deviation bars are due to insufficient numbers of amplifying wells. Note that, to the extent it could be estimated, direction of apparent regulation often differed between the two subjects.