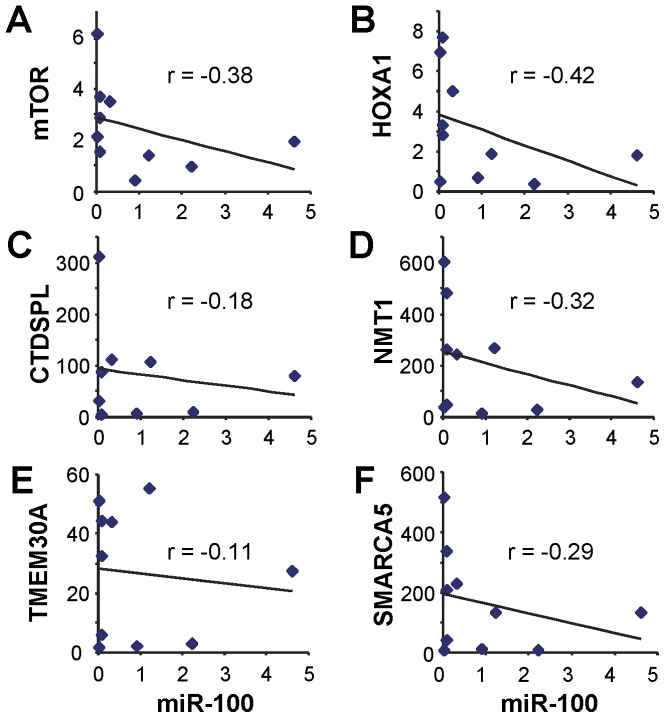
Figure 2. Correlation of miR-100 level and the expression of its target genes in HNSCC.
The level of miR-100 and the expression of mTOR, HOXA1, CTDSPL, NMT1, TMEM30A and SMARCA5 were assessed by qRT-PCR in 10 HNSCC cell lines. Potential correlation of the miR-100 level with the expression of mTOR (A), HOXA1 (B), CTDSPL (C), NMT1 (D), TMEM30A (E), and SMARCA5 (F) was assessed, and the Pearson's correlation coefficient (r) was calculated.

